
Telemetry — plot and export the run's numbers
هذا المحتوى غير متوفر بلغتك بعد.
The Telemetry plot draws the run’s numbers — speed, acceleration, jerk, yaw rate, distance travelled, gap, and time-to-collision — as a time series synced to the playback head. It reads the same for an OpenSCENARIO run as for an imported CommonRoad solution or planning trace, because both are turned into the same recording before the plot sees them. A CSV export sits next to it for analysis in Python or a spreadsheet.
Open the plot
Section titled “Open the plot”Plot in the transport row opens the lane. It is off by default.

Click it once a run has produced a recording, and the lane appears under the timeline with the Speed chip selected:

The toggle only appears once there is something to plot — with no road, or before the first run, the transport row has no Plot button to click.
Quantities
Section titled “Quantities”One quantity is plotted at a time, picked from the chip row above the plot:
| Chip | Unit | What it shows | How it is derived |
|---|---|---|---|
| Speed | km/h | Recorded speed, one line per actor. | The recording’s v, falling back to |vel| if v is missing. |
| Accel | m/s² | Longitudinal (forward/back) acceleration. | Acceleration vector rotated into the vehicle’s heading (esmini GetAccLong). |
| Jerk | m/s³ | Rate of change of Accel. | Δaccel / Δt — esmini has no jerk, so this follows the CommonRoad drivability-checker’s np.diff(acceleration)/dt. |
| Yaw rate | rad/s | Heading rate. | Δheading / Δt, wrapped correctly across the ±π boundary. |
| Distance | m | Distance travelled since the start of the run. | Running sum of step displacements (the odometer), excluding teleport steps. |
| Gap | m | Free-space distance from the ego to each other actor. | The same OBB-to-OBB distance baked into the recording and shown by the info line and verdict. |
| TTC | s | Time to collision from the ego to each other actor. | The same value used by the info line and by TTC-based fail conditions, with a 1.5 s reference line. |
Gap and TTC need an ego actor — without one, those two chips are disabled and the plot falls back to Speed.
Reading the plot
Section titled “Reading the plot”Each visible actor gets its own line: the ego is always the same indigo used elsewhere in the UI, and every other actor gets a color from a fixed palette. The legend sits to the right of the chip row — a colored dot and a name per line — and clicking a name hides or shows that line.
The y-axis auto-ranges to what is currently visible, using a robust
(percentile-based) range rather than raw min/max, so that a single
extreme frame — a hard brake, a discontinuous jump at a cut-in start —
does not flatten the rest of the line. When a value sits outside that
range it is drawn clamped to the edge, and the axis label gets a +
or − to say so:

Gaps in a line mean the value is undefined for that stretch, not zero — most visibly on TTC, which is only defined while an actor is closing on another. TTC also carries a fixed 1.5 s dashed reference line (the same threshold used by the info line’s warning state) and a 20 s display ceiling, so a long, uninteresting tail of large TTC values does not crowd out the 0–5 s range that actually matters:

The display ceiling is a plot-only convenience — the CSV export carries the unclamped values.
Seek and hover
Section titled “Seek and hover”The plot shares its x-axis with the timeline above it, so the same playhead line runs through both. Clicking or dragging inside the plot seeks the run, exactly like dragging on the timeline.
Hovering shows a second, lighter vertical line plus a readout chip with the values at that instant:

Where the numbers come from
Section titled “Where the numbers come from”The values are not a separate implementation — they are esmini’s own formulas, ported to run over the recording instead of recomputed. Gap and TTC are not recomputed at all; they are the same numbers already baked into the recording by the replay engine, so the plot always agrees with the info line and the verdict.
| Quantity | Source |
|---|---|
| Speed, velocity, acceleration, yaw rate | esmini’s finite differences in prepareGroundTruth() |
| Distance travelled (odometer) | esmini’s odometer_ accumulator, excluding teleport steps |
| Gap, TTC | The recording’s baked-in gapByActorId / ttcByActorId (esmini’s free-space OBB distance and TimeToCollision) |
| Jerk | Not present in esmini — the CommonRoad drivability-checker’s np.diff(acceleration)/dt |
This was checked against ground truth, not assumed. Across 16 esmini regression scenarios (33,458 frames, 267,202 data points), speed, velocity, acceleration, and yaw rate matched esmini’s own CSV logger output with zero mismatched frames — the only residual differences were the theoretical rounding limits of the logger’s 6-decimal-place output. The same held for distance travelled once a bug where teleport steps were being counted as travel was found and fixed. Against CommonRoad’s own reactive-planner reconstruction, yaw rate matched to machine precision (differences of order 1e-15), since CommonRoad and esmini use the literal same formula for it.
Acceleration and jerk do not match CommonRoad’s reported velocity
field bit-for-bit, because that field is an instantaneous speed while
drawtonomy (like esmini) derives velocity from position differences —
an average speed over the step. The two differ by up to a·dt/2 in a
constant-acceleration segment, which is a modeling difference, not a
bug; it was confirmed by independently reimplementing esmini’s formula
in Python and getting agreement to 1e-10.
Gap and TTC are deliberately not the same as CommonRoad CriMe’s HW
and TTC. CriMe measures distance along a lane’s curve coordinates
between bumper and bumper, and assumes constant acceleration when
projecting time-to-collision; esmini measures free-space Euclidean
distance between oriented bounding boxes in world coordinates, and
assumes constant velocity. On the same scenario and the same instant,
the two definitions can disagree by an order of magnitude — for
example esmini reporting 47.9 s where CriMe’s equivalent reports 3.3 s
for the same pair of actors. drawtonomy keeps esmini’s definition
everywhere (the plot, the info line, and fail conditions), so all three
always agree with each other; a CriMe-style number is something you
compute from the CSV export yourself, not something the plot tries to
approximate.
Export the data (CSV)
Section titled “Export the data (CSV)”Hamburger menu → Export → Telemetry (.csv) downloads the same
series that the plot draws, as <scenario name>-telemetry.csv:
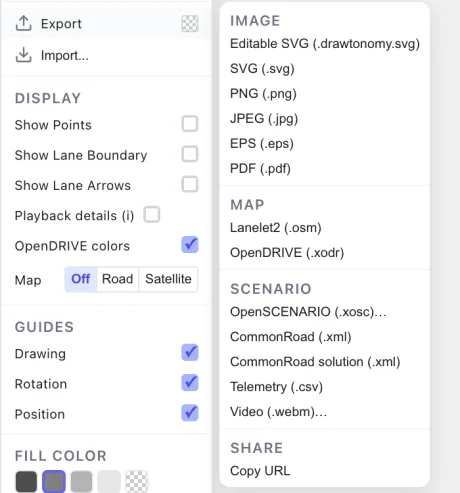
The file is long (tidy) format — one row per (time, actor) pair — so it loads directly into pandas, R, or a spreadsheet’s pivot table without reshaping:
| Column | Unit | Meaning |
|---|---|---|
time_s | s | Simulation time |
actor_id | — | Actor’s internal id |
actor_name | — | Actor’s name |
role | — | ego, npc, pedestrian, or misc |
x_m, y_m | m | World position of the body centre, for every actor (the same frame as CommonRoad states) |
heading_rad | rad | Heading |
speed_mps | m/s | Speed |
vel_x_mps, vel_y_mps | m/s | Velocity vector |
acc_x_mps2, acc_y_mps2 | m/s² | Acceleration vector |
acc_long_mps2, acc_lat_mps2 | m/s² | Longitudinal / lateral acceleration |
jerk_mps3 | m/s³ | Rate of change of longitudinal acceleration |
yaw_rate_radps | rad/s | Heading rate |
odometer_m | m | Distance travelled since the start |
gap_m | m | Free-space distance to the closest closing actor (ego rows only) |
gap_to | — | That actor’s name (ego rows only) |
ttc_s | s | Time to collision to the closest closing actor (ego rows only) |
ttc_to | — | That actor’s name (ego rows only) |
x_m and y_m are the centre of the vehicle body for every actor,
the same point that CommonRoad’s planning problem and solution states
use. For a CommonRoad solution, the ego rows match the solution’s x /
y directly, with no rear-axle offset. For an OpenSCENARIO file it is
the centre of the entity’s BoundingBox, so it differs from the
reference point that esmini’s own CSV logs. The velocity, acceleration, and
odometer columns are differences of the reference point (rear axle),
the same point esmini differences. When the vehicle turns, they are not
the difference of x_m / y_m.
Numbers are written with 6 decimal places, matching esmini’s own %f
output. A blank cell means the value is undefined for that frame (for
example, the first frame of a run has no previous frame to difference
against, so velocity, acceleration, yaw rate, and jerk are blank).
gap and ttc (and their _to columns) are only filled in on the
ego actor’s row — other actors’ rows leave them blank rather than
repeating every pairwise distance.
There is no header comment line, so the file loads as-is:
import pandas as pdimport matplotlib.pyplot as plt
df = pd.read_csv("cutin-telemetry.csv")ego = df[df["role"] == "ego"]
plt.plot(ego["time_s"], ego["speed_mps"])plt.xlabel("time [s]")plt.ylabel("speed [m/s]")plt.show()
See also
Section titled “See also”- Playback — the transport row the Plot button lives in, and the verdict badge that reads the same gap/TTC values.
- End and fail conditions — fail conditions built on the same distance and speed quantities.
- esmini — the simulation engine whose formulas the plot ports.