Import a ROS OccupancyGrid (.pgm + .yaml)
drawtonomy understands the ROS map_server format used by
nav2, Cartographer, Gmapping, and
similar SLAM tools.
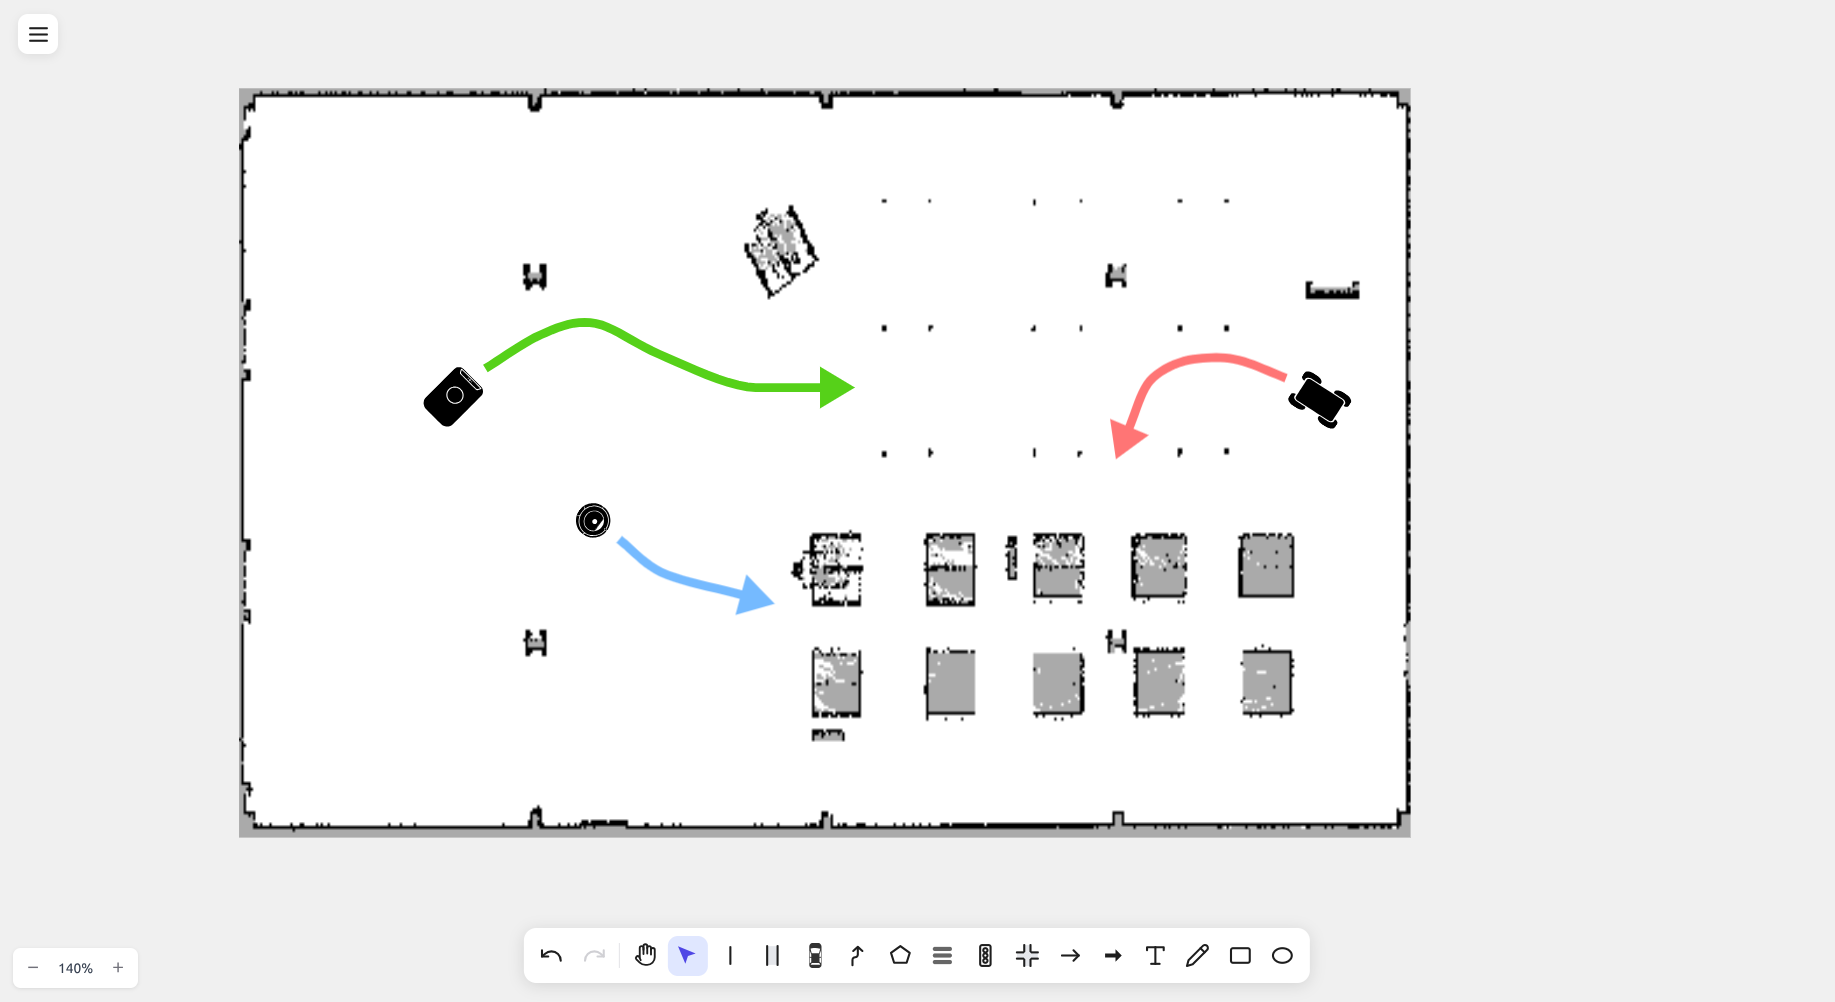
The screenshot shows a real warehouse occupancy grid (occupied cells black, free cells white) with paths and obstacles drawn directly over it inside drawtonomy.
Import
Section titled “Import”- Open the File menu → Import.
- Select both the
.pgmand matching.yamlfile together in the file dialog. - drawtonomy reads the YAML metadata (resolution, thresholds) and renders the grid on the canvas.
If you select only the .pgm and no .yaml, drawtonomy uses
defaults (resolution = 0.05 m/px, standard occupancy thresholds).
Cell colouring
Section titled “Cell colouring”| Cell | Color |
|---|---|
| Occupied | Black |
| Free | White |
| Unknown | Grey |
Cells render at a scale that matches drawtonomy’s lane dimensions, so you can draw lanes, paths, and shapes directly on top — exactly like the screenshot above.
Tools tested
Section titled “Tools tested”drawtonomy has been used with maps from nav2, Cartographer, and
Gmapping. Other producers should work as long as they emit the
standard map_server .pgm + .yaml pair.