ROS OccupancyGrid (.pgm + .yaml) इम्पोर्ट करें
drawtonomy nav2, Cartographer,
Gmapping, और इसी तरह के SLAM टूल्स द्वारा उपयोग किए जाने वाले
ROS map_server फ़ॉर्मैट को समझता है।
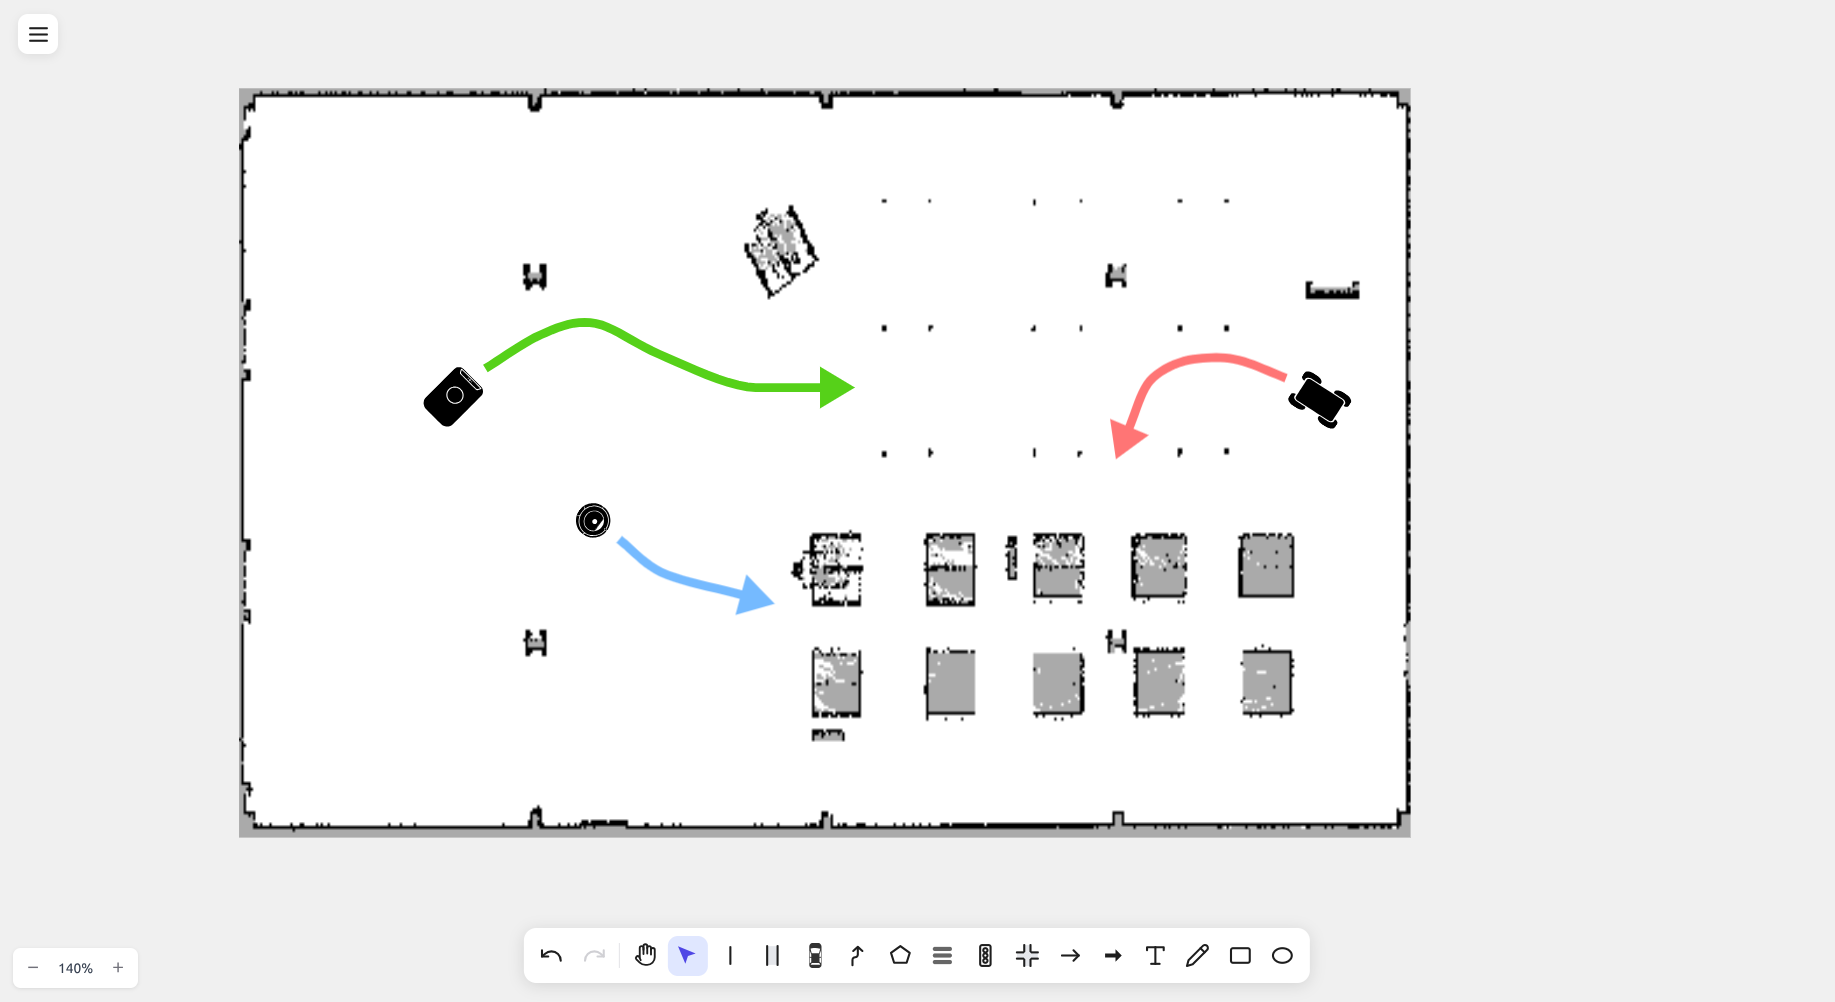
स्क्रीनशॉट एक वास्तविक warehouse occupancy grid (occupied cells black, free cells white) दिखाता है जिस पर drawtonomy के अंदर सीधे पाथ और बाधाएं ड्रॉ की गई हैं।
इम्पोर्ट
Section titled “इम्पोर्ट”- File मेनू → Import खोलें।
- file dialog में दोनों
.pgmऔर matching.yamlफ़ाइल एक साथ चुनें। - drawtonomy YAML metadata (resolution, thresholds) पढ़ता है और कैनवस पर ग्रिड को render करता है।
यदि आप केवल .pgm और कोई .yaml नहीं चुनते हैं, तो drawtonomy
डिफ़ॉल्ट का उपयोग करता है (resolution = 0.05 m/px, मानक
occupancy thresholds)।
Cell colouring
Section titled “Cell colouring”| Cell | रंग |
|---|---|
| Occupied | काला |
| Free | सफेद |
| Unknown | ग्रे |
Cells एक scale पर render होते हैं जो drawtonomy के लेन dimensions से match करता है, इसलिए आप सीधे ऊपर लेन, पाथ, और shapes ड्रॉ कर सकते हैं — ठीक ऊपर के स्क्रीनशॉट की तरह।
Tools जो tested हैं
Section titled “Tools जो tested हैं”drawtonomy को nav2, Cartographer, और Gmapping से बने मैप के
साथ उपयोग किया गया है। अन्य producers काम करने चाहिए जब तक वे
मानक map_server .pgm + .yaml pair emit करते हैं।