
Test management — requirements, test cases, and results as files
Nội dung này hiện chưa có sẵn bằng ngôn ngữ của bạn.
Keep requirements, test cases, and results as files in a folder, and
open them in drawtonomy to see where each version passes or fails and
replay any run. Everything is plain files — Markdown requirements,
testcase.yaml, OpenSCENARIO, and one JSON per test case per
software version — so the suite is reviewed and versioned like code,
and drawtonomy only reads it. Nothing is uploaded and there is no
server to set up.
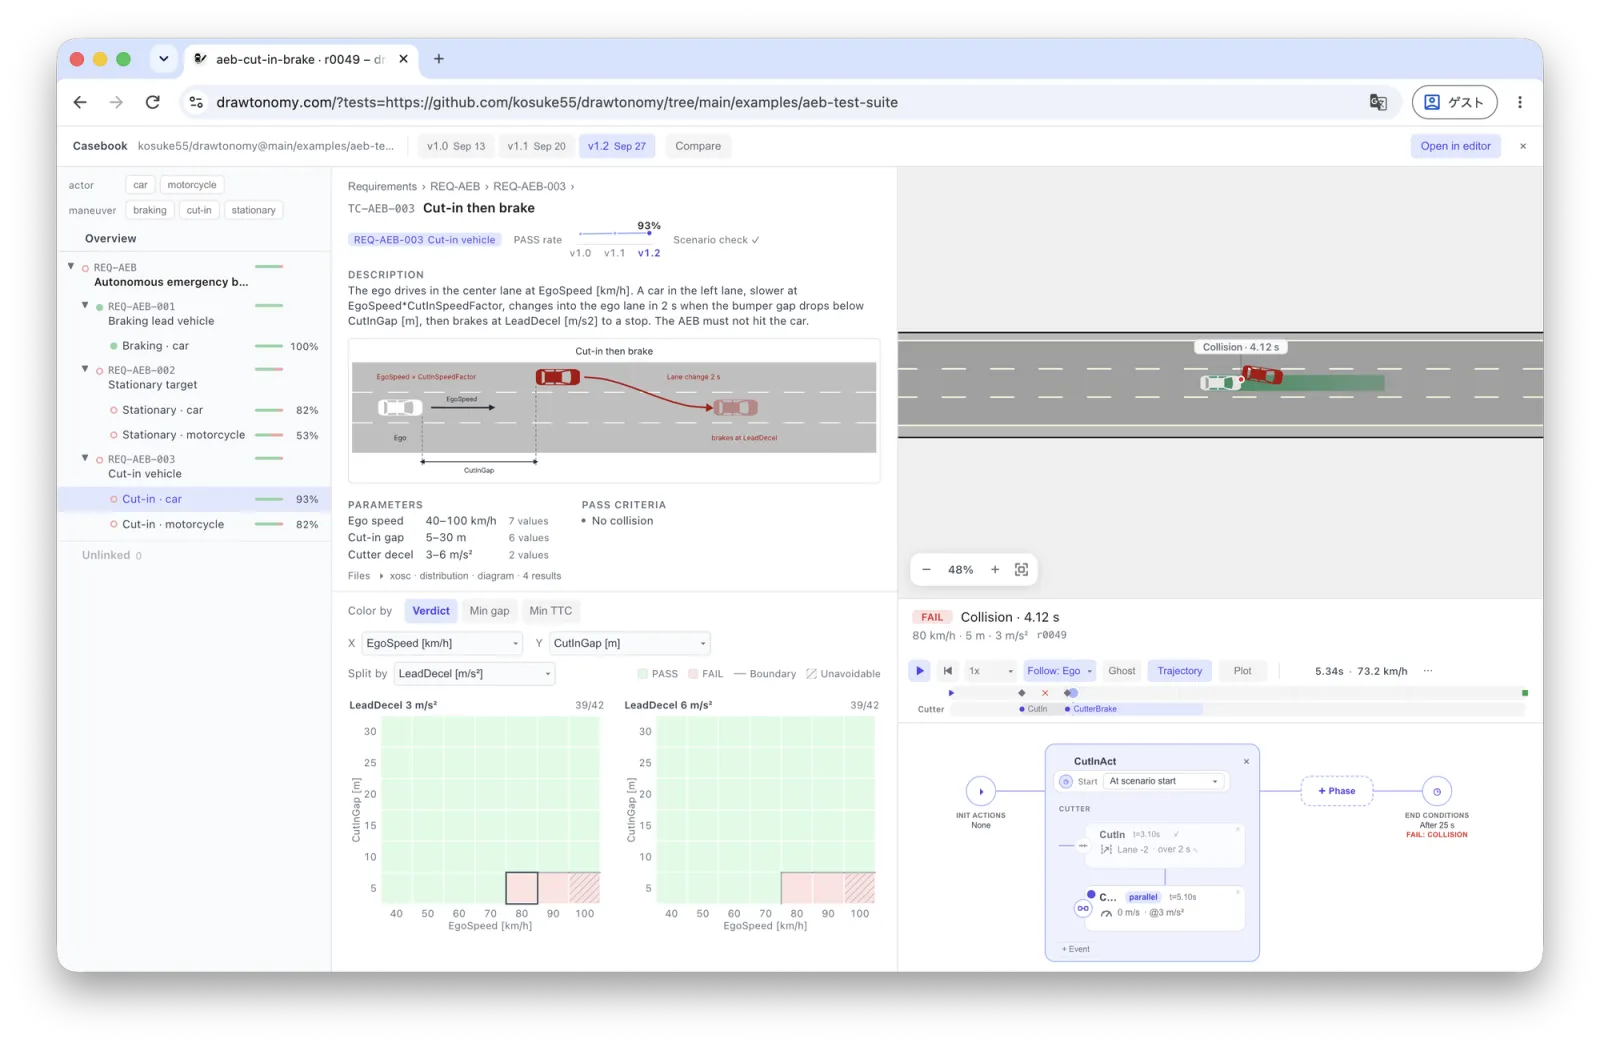
Open the example
Section titled “Open the example”The example suite tests a sample automatic emergency braking (AEB) function: 4 requirements, 5 test cases, 454 concrete scenarios, and the results of three versions (v1.0, v1.1, v1.2).
Open the AEB test suite in drawtonomy
Where the suite lives
Section titled “Where the suite lives”The suite is a folder of files, so it can live anywhere that serves files. Supported today:
-
A public GitHub repository — put the folder URL after
?tests=:https://www.drawtonomy.com/?tests=https://github.com/<owner>/<repo>/tree/<branch>/<folder> -
A folder on your computer — Open tests… in the menu. Nothing leaves the browser.
More locations will follow.
Folder layout
Section titled “Folder layout”requirements/ REQ-*.mdtestcases/ <group>/<variant>/testcase.yaml + .xosc, .pvd.xosc, .drawtonomy.svgresults/ <sut>@<version>/<TC-ID>.json + logs/- A requirement is a Markdown file with an
id, atitle, and an optionalparent. Test cases link to requirements many-to-many. - A test case is a folder with
testcase.yaml: the logical scenario (.xoscplus the parameter ranges in.pvd.xosc), the pass criteria, a description, and a diagram. - A test run is one folder under
results/: one version of the software under test (SUT) over the whole suite. Each entry ofrunsis one concrete scenario with its verdict, KPIs, and optionally the logged motion to replay.
The full schema is in FORMAT.md, and the example’s README shows how its results were produced with esmini. To test your own software, run the same scenarios and parameters in your simulator and write the same result files.
Overview page
Section titled “Overview page”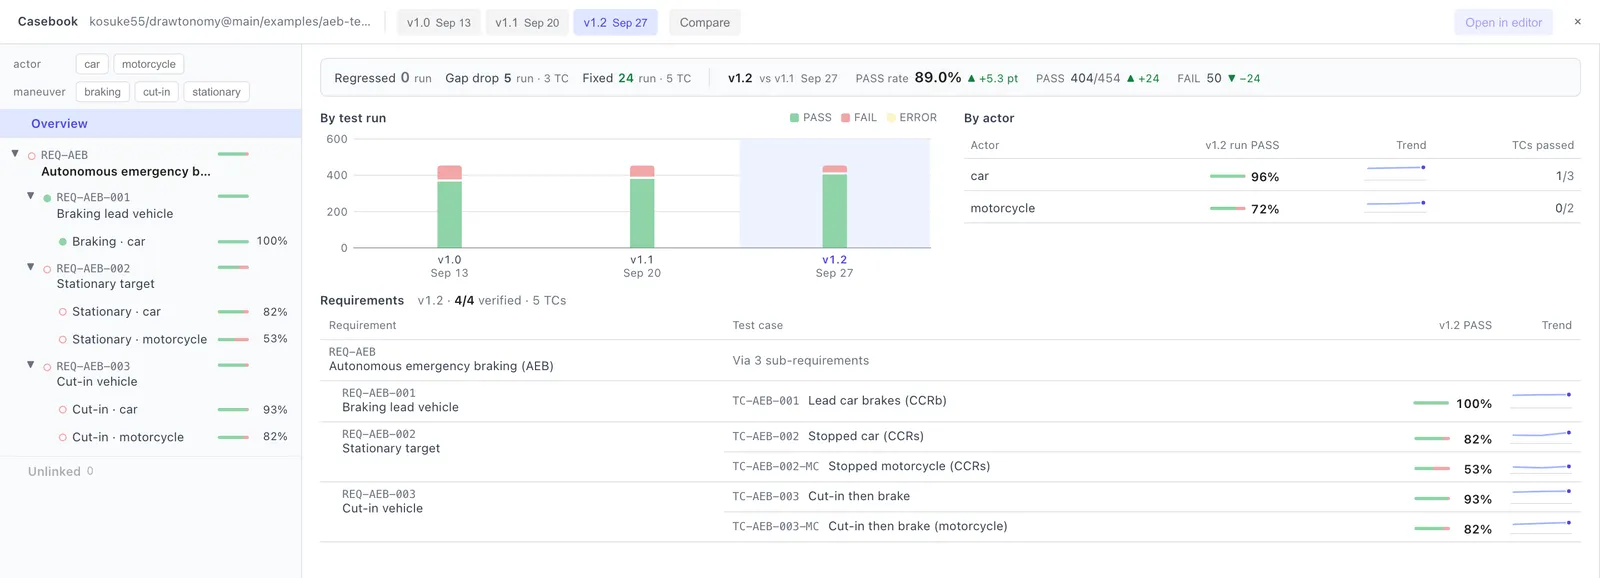
The strip at the top compares the selected version with the previous one: Regressed runs went from PASS to FAIL, Gap drop runs still pass but with a noticeably smaller minimum gap, and Fixed runs went from FAIL to PASS. Click a count to list the runs. Below it are the results of each test run, the pass rate by the kind of other road user (By actor), and which requirements are verified by their test cases.
The left Navigator shows the same requirement tree with a status
dot and pass rate per line. The actor and maneuver tags above it
filter everything on screen; Unlinked collects test cases that no
requirement points to.
Requirement page
Section titled “Requirement page”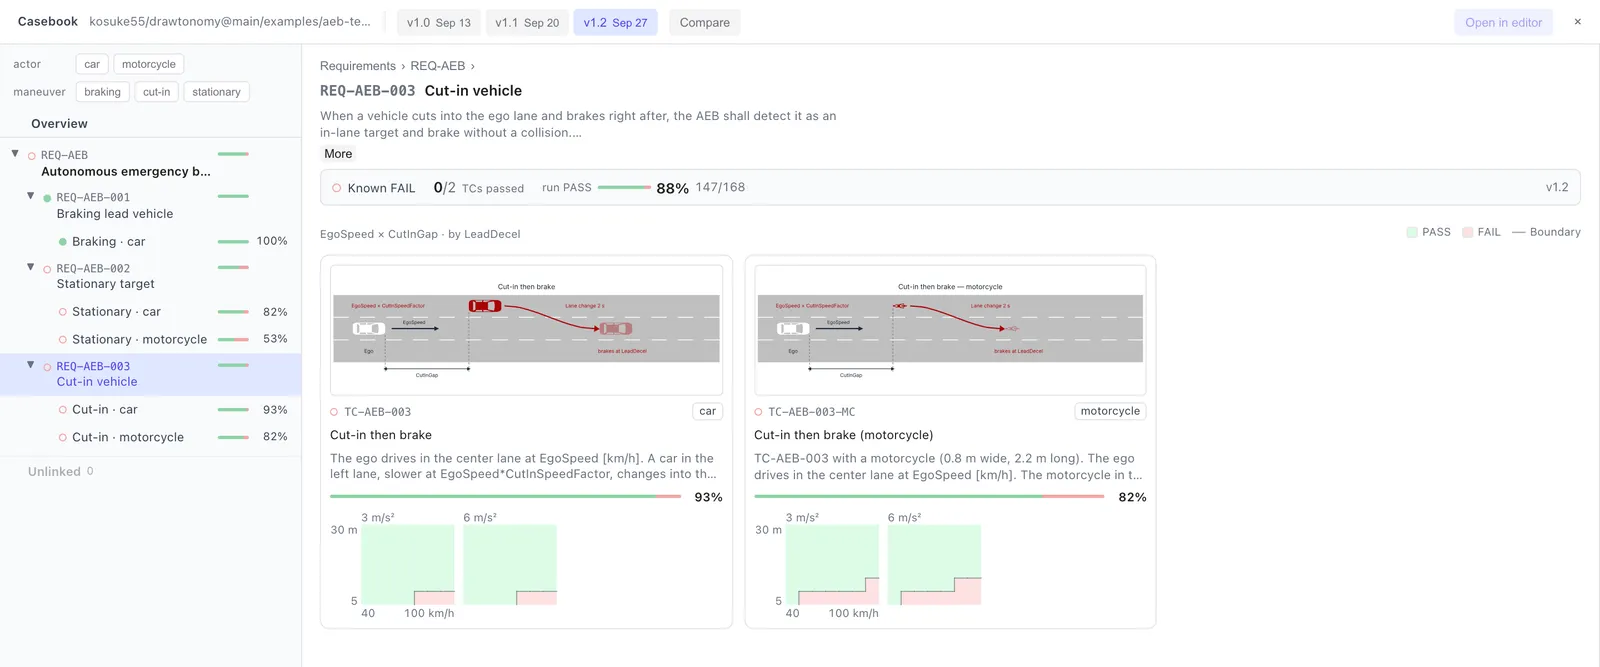
Click a requirement to read its text and see a card for each test case that verifies it: the diagram, the description, the pass rate, and a thumbnail of the heatmap, so you can see at a glance where each test case fails.
Test case page
Section titled “Test case page”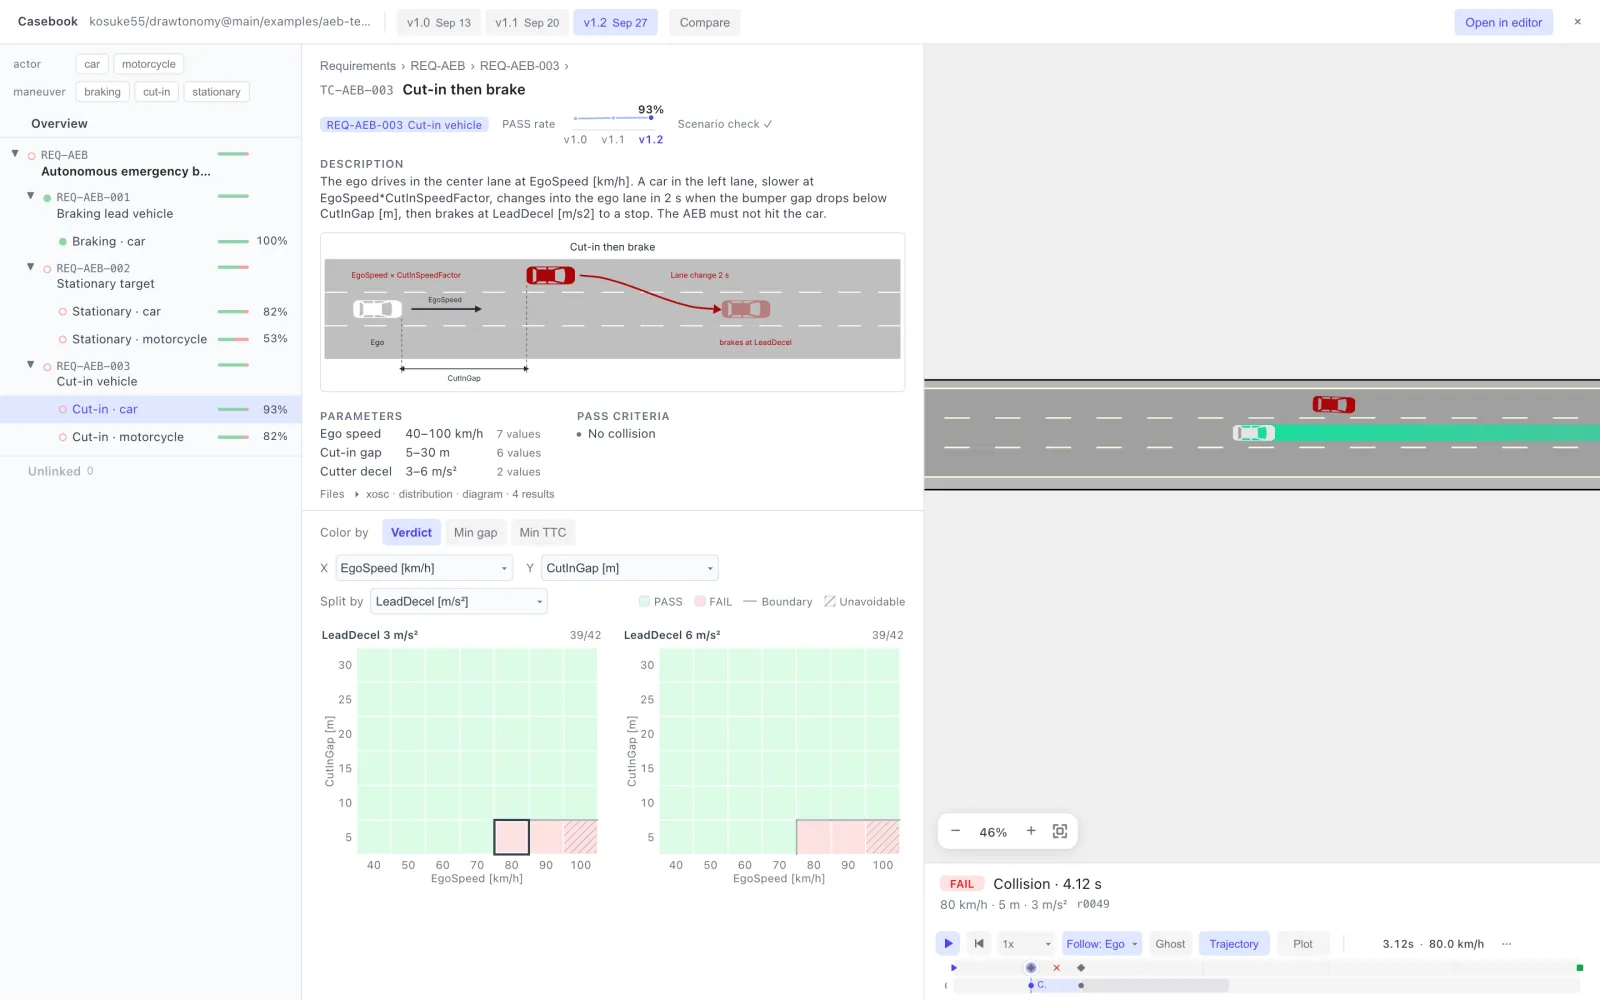
The top half is the test case itself: the Description and the diagram (the functional scenario), then the Parameters with their ranges and the Pass criteria. The pass rate across versions sits next to the requirement chip.
The heatmap is the parameter space of the logical scenario. Each cell is one concrete scenario. Pick the X and Y axes and a Split by parameter for the side-by-side panels.
- Boundary — the thin line between cells with different verdicts, i.e. where the SUT stops coping.
- Unavoidable (hatched) — runs that collide even with ideal braking from the start. A FAIL there is a limit of the scenario, not of the SUT.
- Color by — Verdict (PASS / FAIL), or the value of Min gap or Min TTC, to see how close the passing cells came.
Replay a run
Section titled “Replay a run”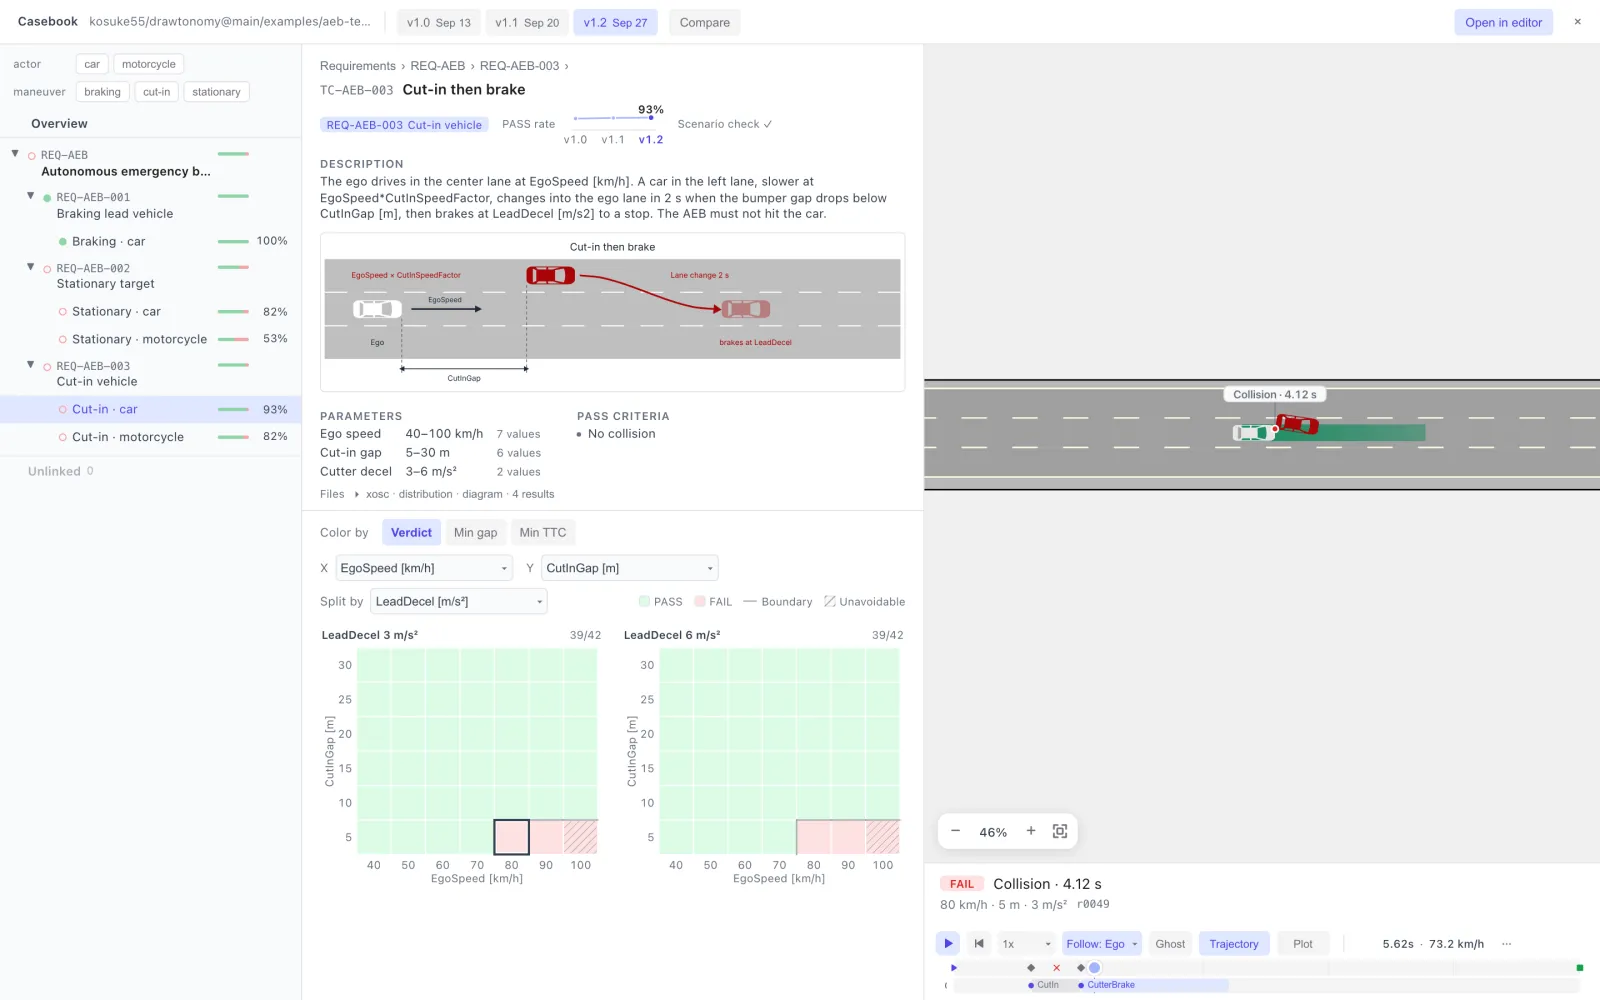
Click a cell to replay that run on the right. A PASS run plays from the
start; a FAIL run starts one second before the failure and stops at the
collision, marked on the canvas (Collision · 4.12 s). The summary
below gives the verdict, the reason, and the parameter values; the
playback bar has the usual Follow, Ghost, Trajectory (the
ego’s planned path), and Plot controls, and the canvas zooms with
the buttons in its corner. Open in editor opens the run in the full
scenario editor.
Compare versions
Section titled “Compare versions”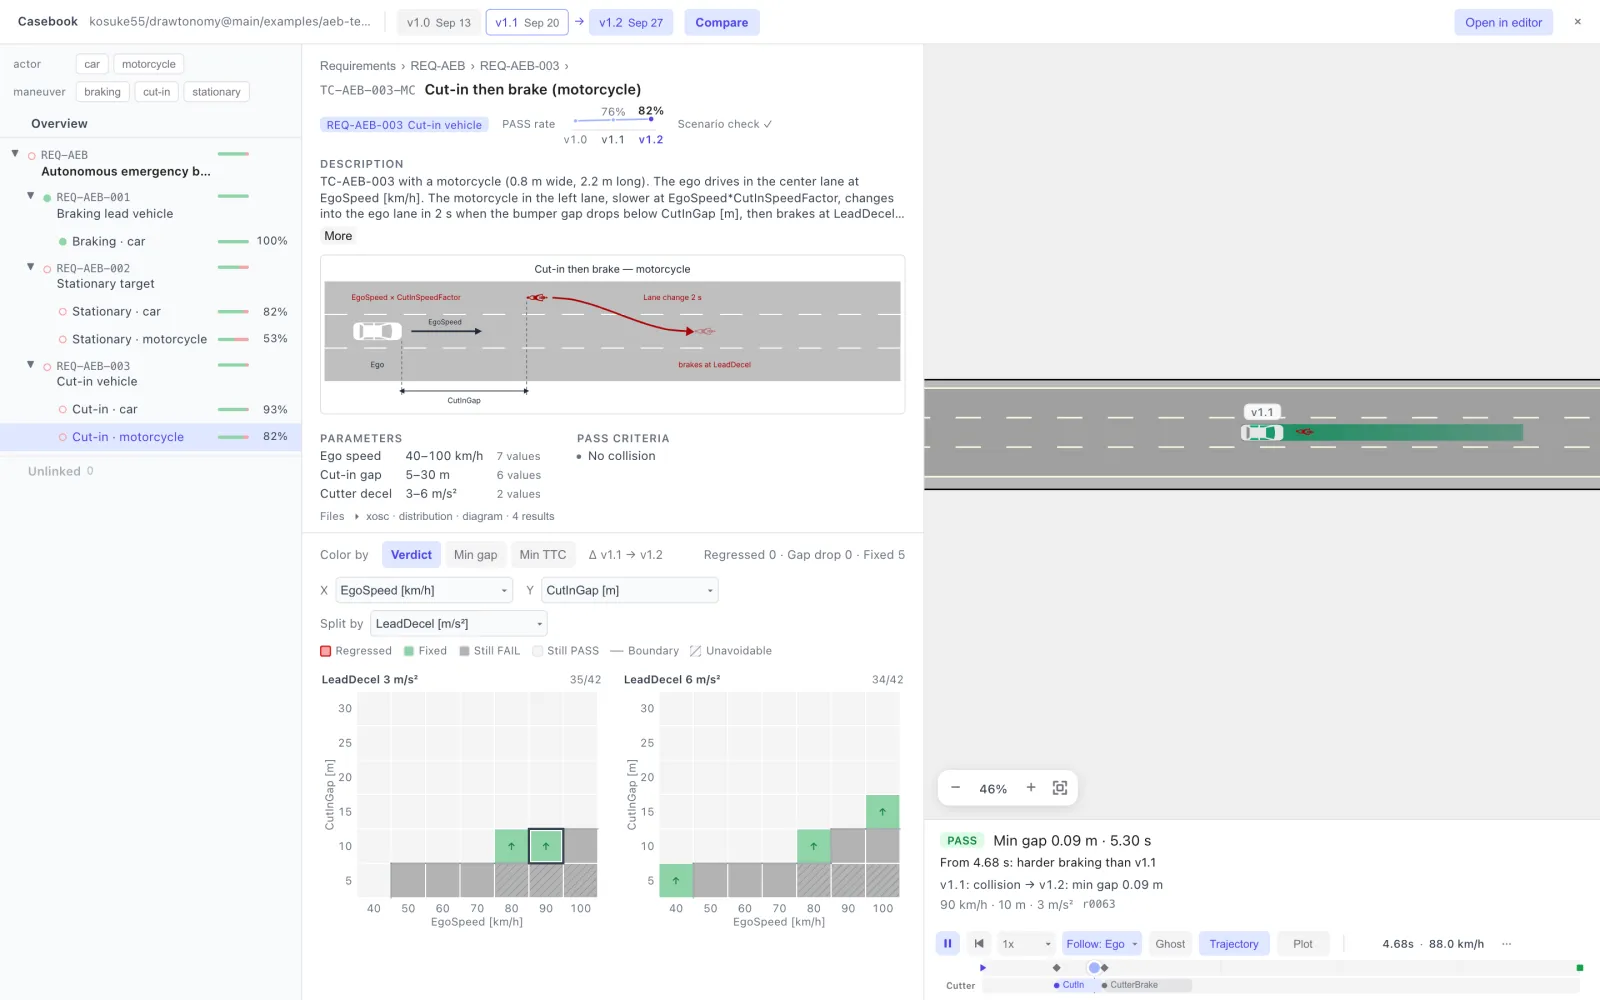
Click Compare in the top bar. The selected version is compared with
the one before it; click a chip to change the version you look at, and
Alt+click another chip to change what it is compared with. The heatmap
then shows the change, Δ v1.1 → v1.2: Regressed,
Fixed, Still FAIL, and Still PASS, with the counts next to
it. When you replay a cell, the ego of the older version drives
alongside as a Ghost labelled with its version, and the summary
tells you where the two runs start to differ (for example, From 4.68 s: harder braking than v1.1).
Glossary
Section titled “Glossary”The terms follow ISO 34501 / 34505 and ISTQB.
| Term | In the files |
|---|---|
| Functional scenario | The description and the diagram (.drawtonomy.svg) |
| Logical scenario | The .xosc plus the parameter ranges (.pvd.xosc) |
| Concrete scenario | One set of parameter values: one heatmap cell, one run |
| Test case | testcase.yaml: logical scenario + pass criteria + SUT |
| Test suite | The whole folder |
| Test run | One SUT version over the whole suite: results/<sut>@<version>/ |
| Requirement | requirements/*.md, linked to test cases many-to-many |
See also Functional, logical, and concrete scenarios.
Limits
Section titled “Limits”- On GitHub, only public repositories. Private repositories are not supported yet.
- Without signing in, GitHub allows 60 API requests per hour. Opening a suite uses a few; repeated reloads can hit the limit.
- The example has hundreds of runs. Suites with many thousands of runs or very large logs are not the target yet.